
In Part 1 of the Data Science series, we talked about what data science actually means. In this second post, we will explore data science in action, and how it can be used to solve everyday business problems to give those using it a competitive edge.
The beauty of data science is that it isn’t a product, but a methodology. This means it can be applied to a wide range of business situations, from Netflix to DHL - it is never a one size fits all approach. Data science adapts and moulds to solve individual business problems.
The unique value a data scientist provides for a business is the ability to connect two very different fields: science and business. This hybrid provides a business with a clearer vision of the future and a competitive advantage over traditional decision making processes.
Data science is still an emerging field, so understandably, its value is not widely understood. Which brings us to a real life example - we recently worked with one of our clients to solve a common business problem using data science.
This work is part of an ongoing R&D project, which is still under the radar and expected to release later this year. To keep the reveal until the eventual release, we have chosen not to name them in this post and will refer to them as Client X.
The challenge
Client X’s existing forecasting system was quite simply not fit for purpose. It was incapable of capturing specific features of the historical data. As a result, the future projections were constant, only showing an average of all data points. The historical data had clear seasonal trends that the team was aware of, however, these trends were not being reflected in the forecast.
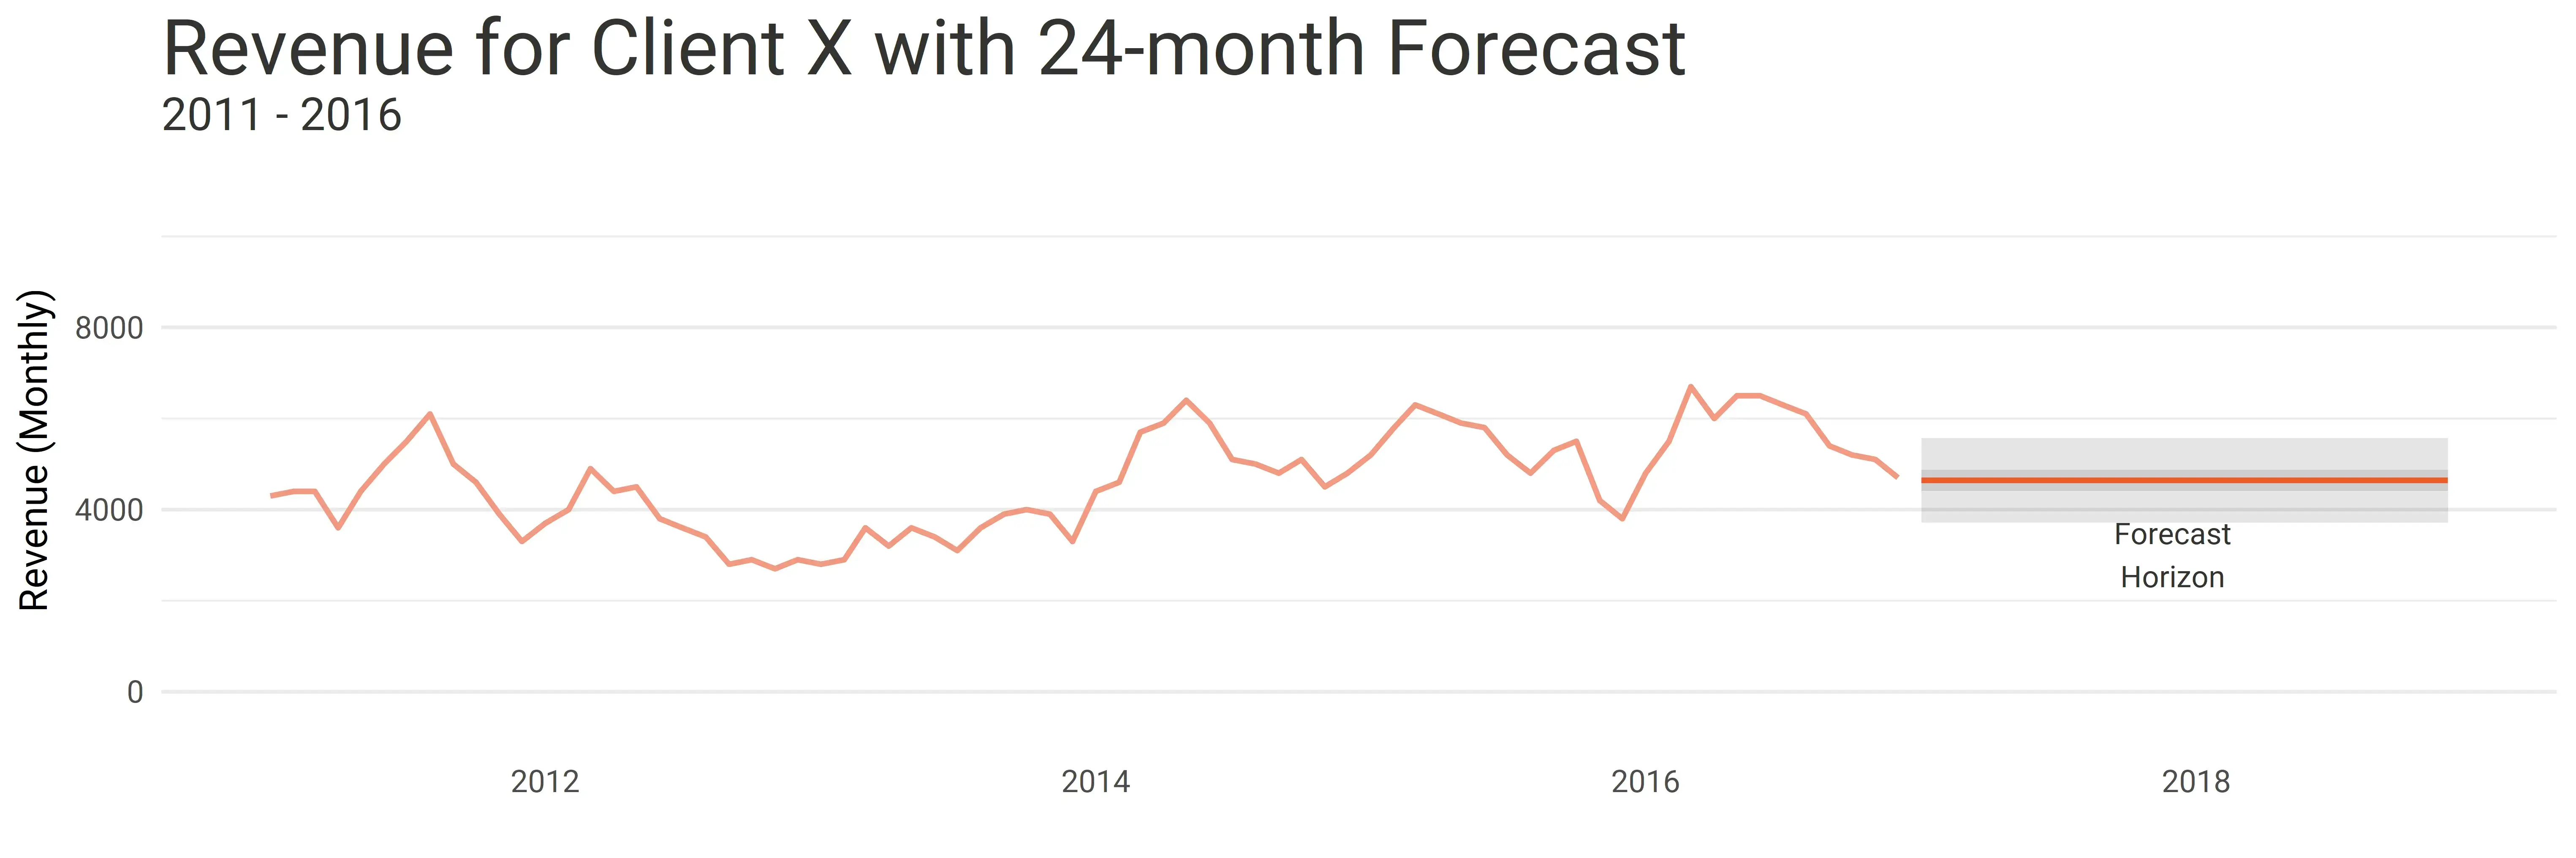
The above forecast shows what Client X was seeing when trying to project future revenue - a flat forecast which is not the best view
The goal
To develop a brand new forecasting engine. Client X wanted the new engine to have the ability to adjust itself automatically and fit multiple statistical models to the time series.
Broadly, a statistical model, is a collection of mathematical equations used to generate predictions.
Through analysis we would then choose the best performing model and produce forecasts.
Considerations
The challenge with this particular business problem was that the whole system needed to work seamlessly with minimal intervention. The forecasting results also needed to integrate into a profitability dashboard. This integration meant we had to think about every scenario the model had to cater for.
The data science approach - CRISP-DM
We approached the problem using the data science methodology, CRISP-DM and delivered a fully working, fault tolerant product.
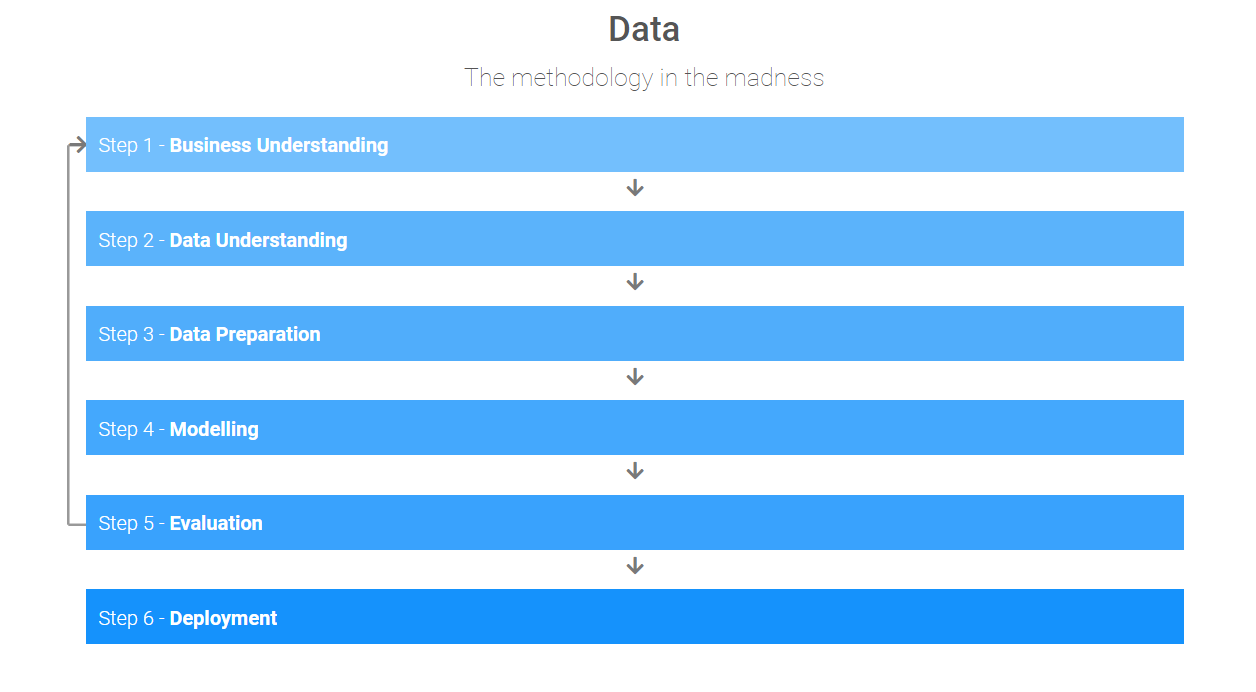
As you may remember from the last blog post, here are the six main steps of CRISP-DM:
- Business Understanding
- Data Understanding
- Data Preparation
- Modelling
- Evaluation
- Deployment
It’s important to remember that in real life, CRISP-DM happens naturally. You do not say to yourself “Oh! We are at 2. Data Understanding right now!” or “Oh no! I am in Data Preparation now. I cannot go back because it does not fit the methodology”. No human works like that. These things become a part of the workflow and are instinctive to a data scientist - able to be adapted when needed.
1. Business Understanding - the most important step of the whole process.
We had a series of meetings with Client X in order to fully understand their challenges and goals. It was important to communicate the steps of working through the solution back to them. This let Client X reflect on the solution and provided confidence that we understood the unique requirements of their business, and would carefully handle the solution with tested methodology.
It is critical to understand what you both want to achieve. Defining concrete requirements will mitigate any misunderstandings during the development process that can cause time, money and ultimately risk the relationship.
2. Data Understanding - figuring out where the data is and how to get to it.
Sometimes we need to work with clients to get access to their servers and make sure they have set up necessary permissions. In most cases, corporate data is stored in data silos with tens of databases and thousands of tables.
Once a data scientist gets access and knows where to look, the next step is understanding the structure of the data. This allows us to judge the state of the data, including whether we need to re-shape, clean, get rid of missing entries if any and figure out any outliers.
In the case of Client X, we were lucky enough to get sample data directly from them. This was enough for the initial modelling.
What Data Scientists
spend the most time doing
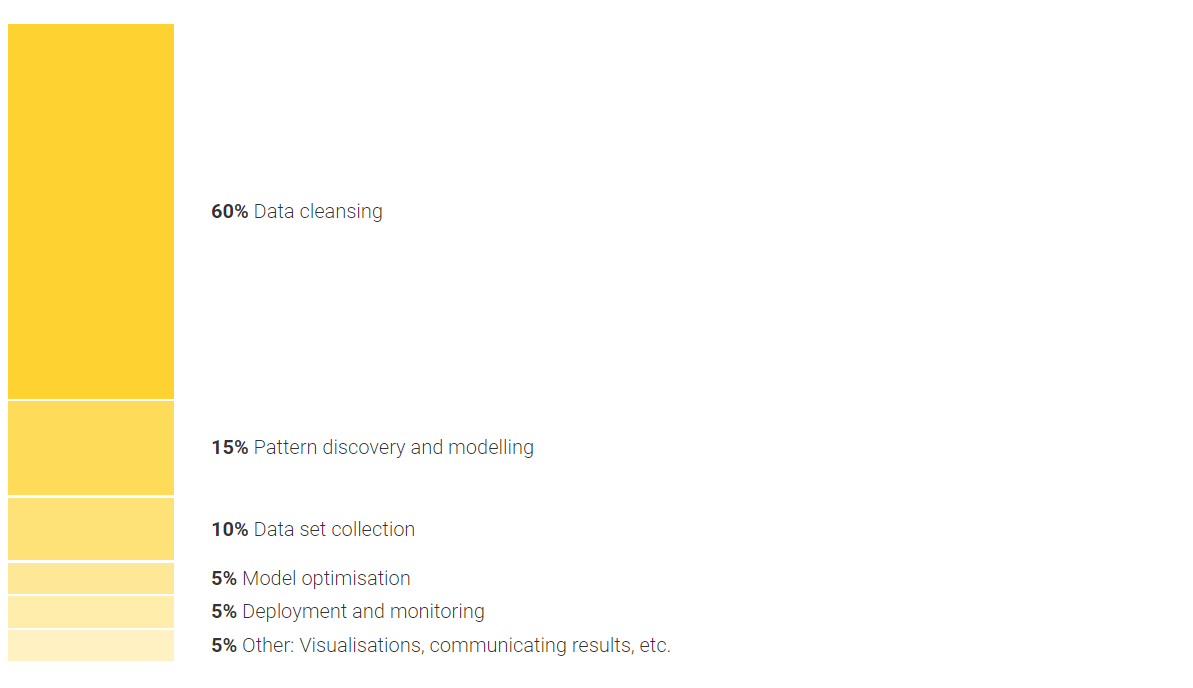
3. Data Preparation - extracting and cleaning up the data (generally the most time consuming step).
This part can take up to 60% of the whole process time.
This is because in most cases, the data is not yet suitable for what you want out of it.
Every organisation also has a different approach to storing their data, the uniqueness of the way they store their data is individual like a fingerprint. You will not find the same structure between two companies, or even within the same company across different departments.
After navigating our way through the data and working with sample data, we often find outliers in the data set. They'll either be expected, or come as a total surprise to the team we're working with. Even in the data cleansing stage, some new insights can be discovered.
After all of our data curation work, we are ready to fit different models to provide forecasts - which takes us to the next step.
4. Modelling
Once the data scientist has the data in a shape they can use, they need to decide on which model they will be training. The model is determined by the type of problem you are trying to solve, for example, predicting the future value of a variable, or forecasting what your revenue will look like in three months’ time. There are so many methods to use. And finding the correct model requires an expert’s insights into the company, data set and the problem at hand.
In Client X’s case, we were required to come up with correct forecasts for different department budgets and this had to be done seamlessly without human intervention. This was a challenging task as there isn’t one algorithm that fits all time series. Our approach was to gather all the algorithms and choose the right one with correct metrics. If the time series somehow changes behaviour, we would still be flexible enough to move to a different algorithm.
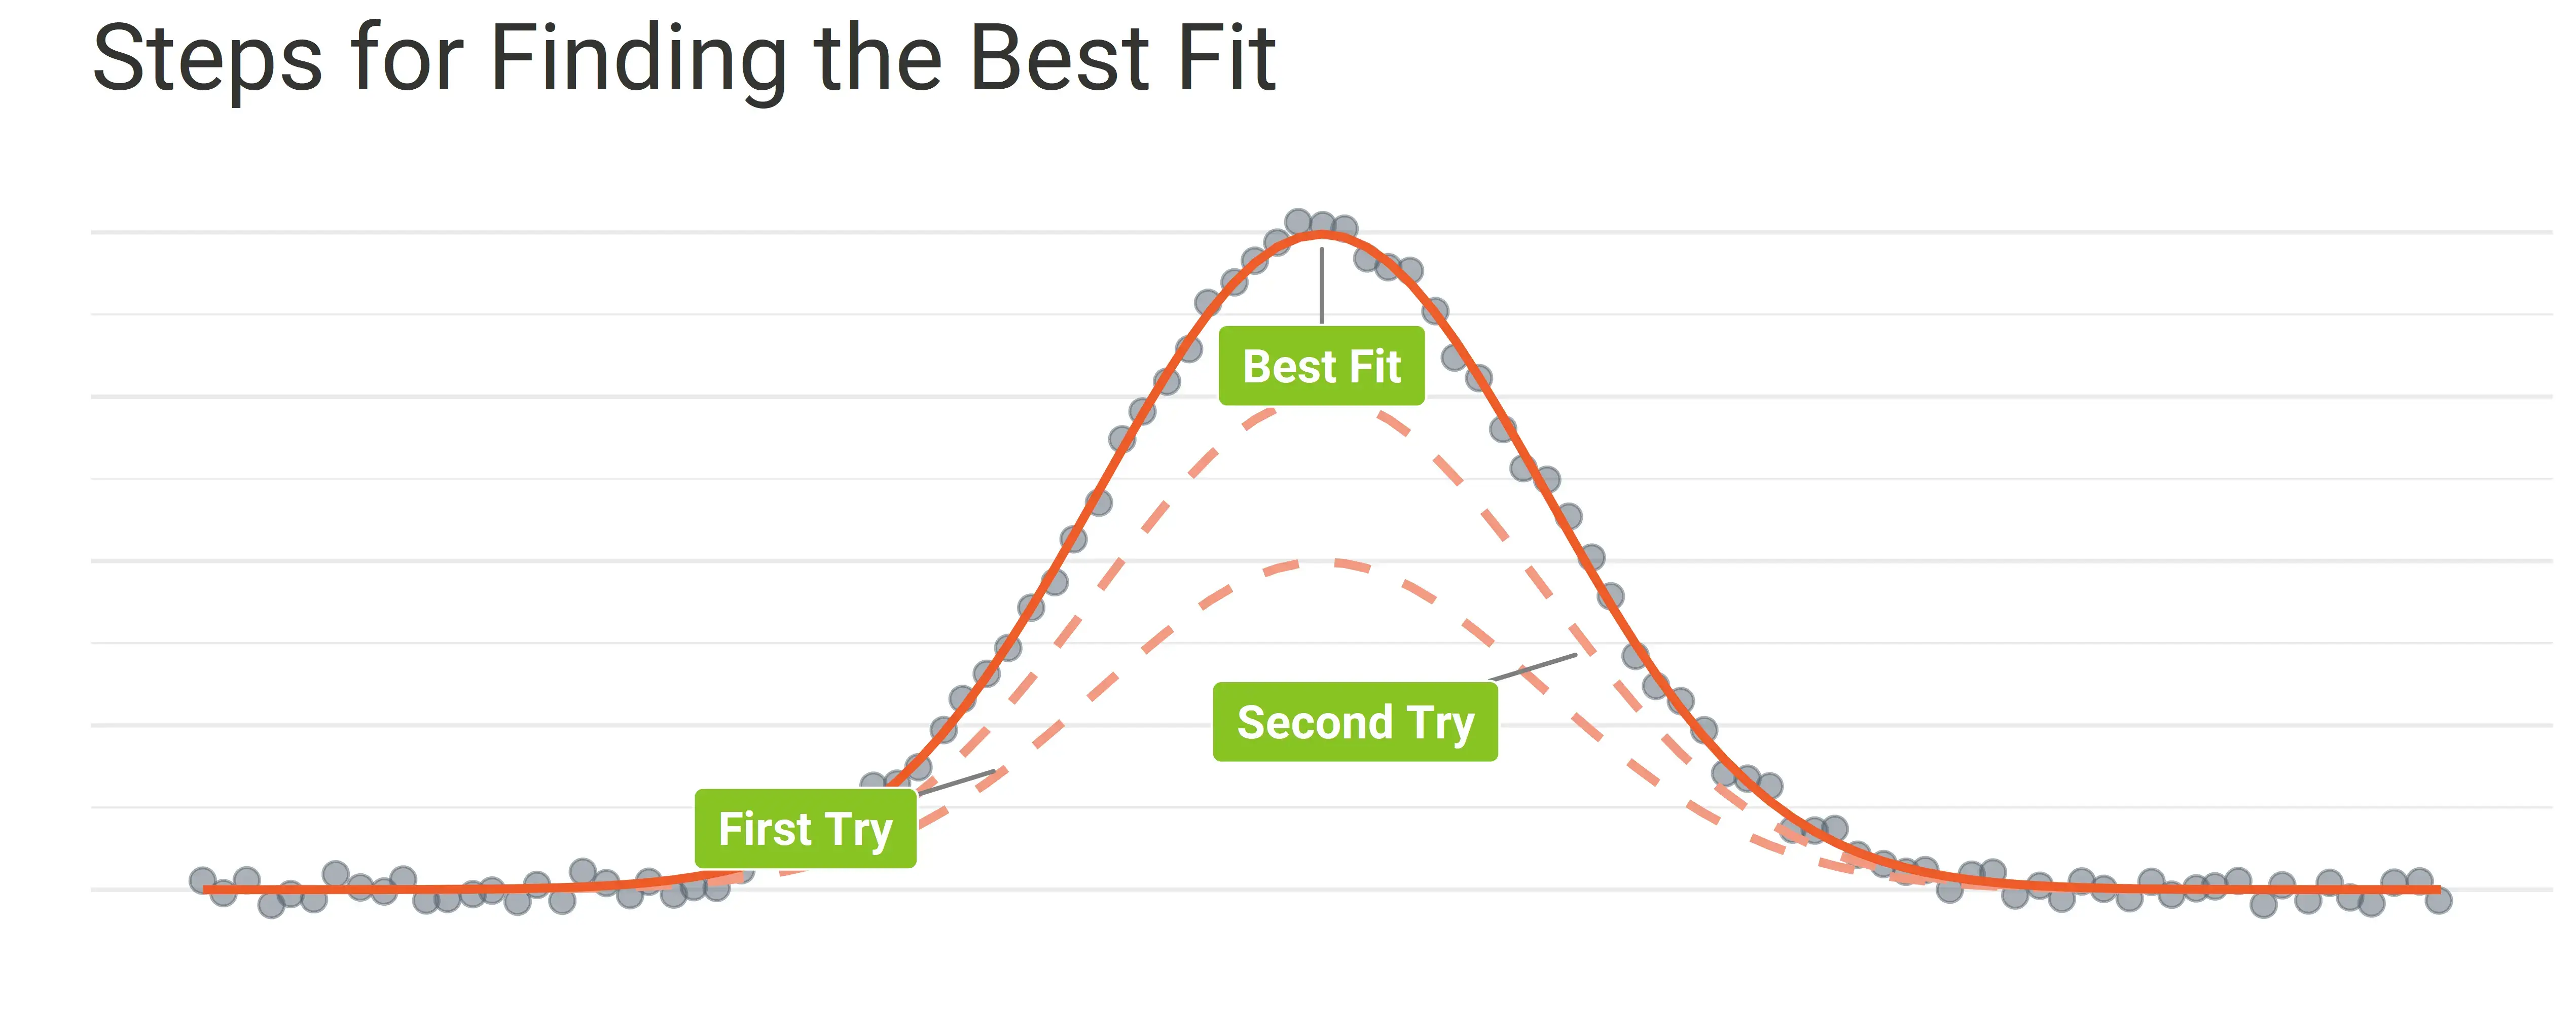
To find the best model for a particular problem, we'll choose something which is a relatively close approximation - then finetune it until we're happy with the fit.
5. Evaluation
It’s now time to test the selected model with data that it has not seen before. This is to ensure the model adapts well to similar data sets. A well balanced model will fit data that has not seen before with the highest of accuracy. Evaluation is one of the most important steps and it needs to be performed every time we re-train the models.
With Client X, evaluation was done comparing the real values of the timeseries to the fitted value and finding out how much predicted data differs from historical data. This is one of the most widely used evaluation methods when trying to fit multiple time series models to the same data set.
6. Deployment
The last step is to put your code into production. It won’t do any good if it sits by itself! So, it's time for the business to reap the benefits of the solution by integrating it into the existing system.
Once we had finalised the modelling for Client X, we put the code into the development environment for the front-end developers to pick up.
But the data scientist’s job is not finished, creating data analytics solutions requires iterations. We reiterated the whole process until all errors, bugs and small hiccups had been ironed out. We also needed to adjust the engine behind the scenes that did the forecasts. You cannot foresee any issues accurately without putting your code to test with real data sets - and it’s best to troubleshoot initially then deal with any big problems later.
After a couple of iterations, we were ready to present the solution to Client X - including the forecasting engine that now has peaks and troughs in line with seasonality - the constant forecast is no more!
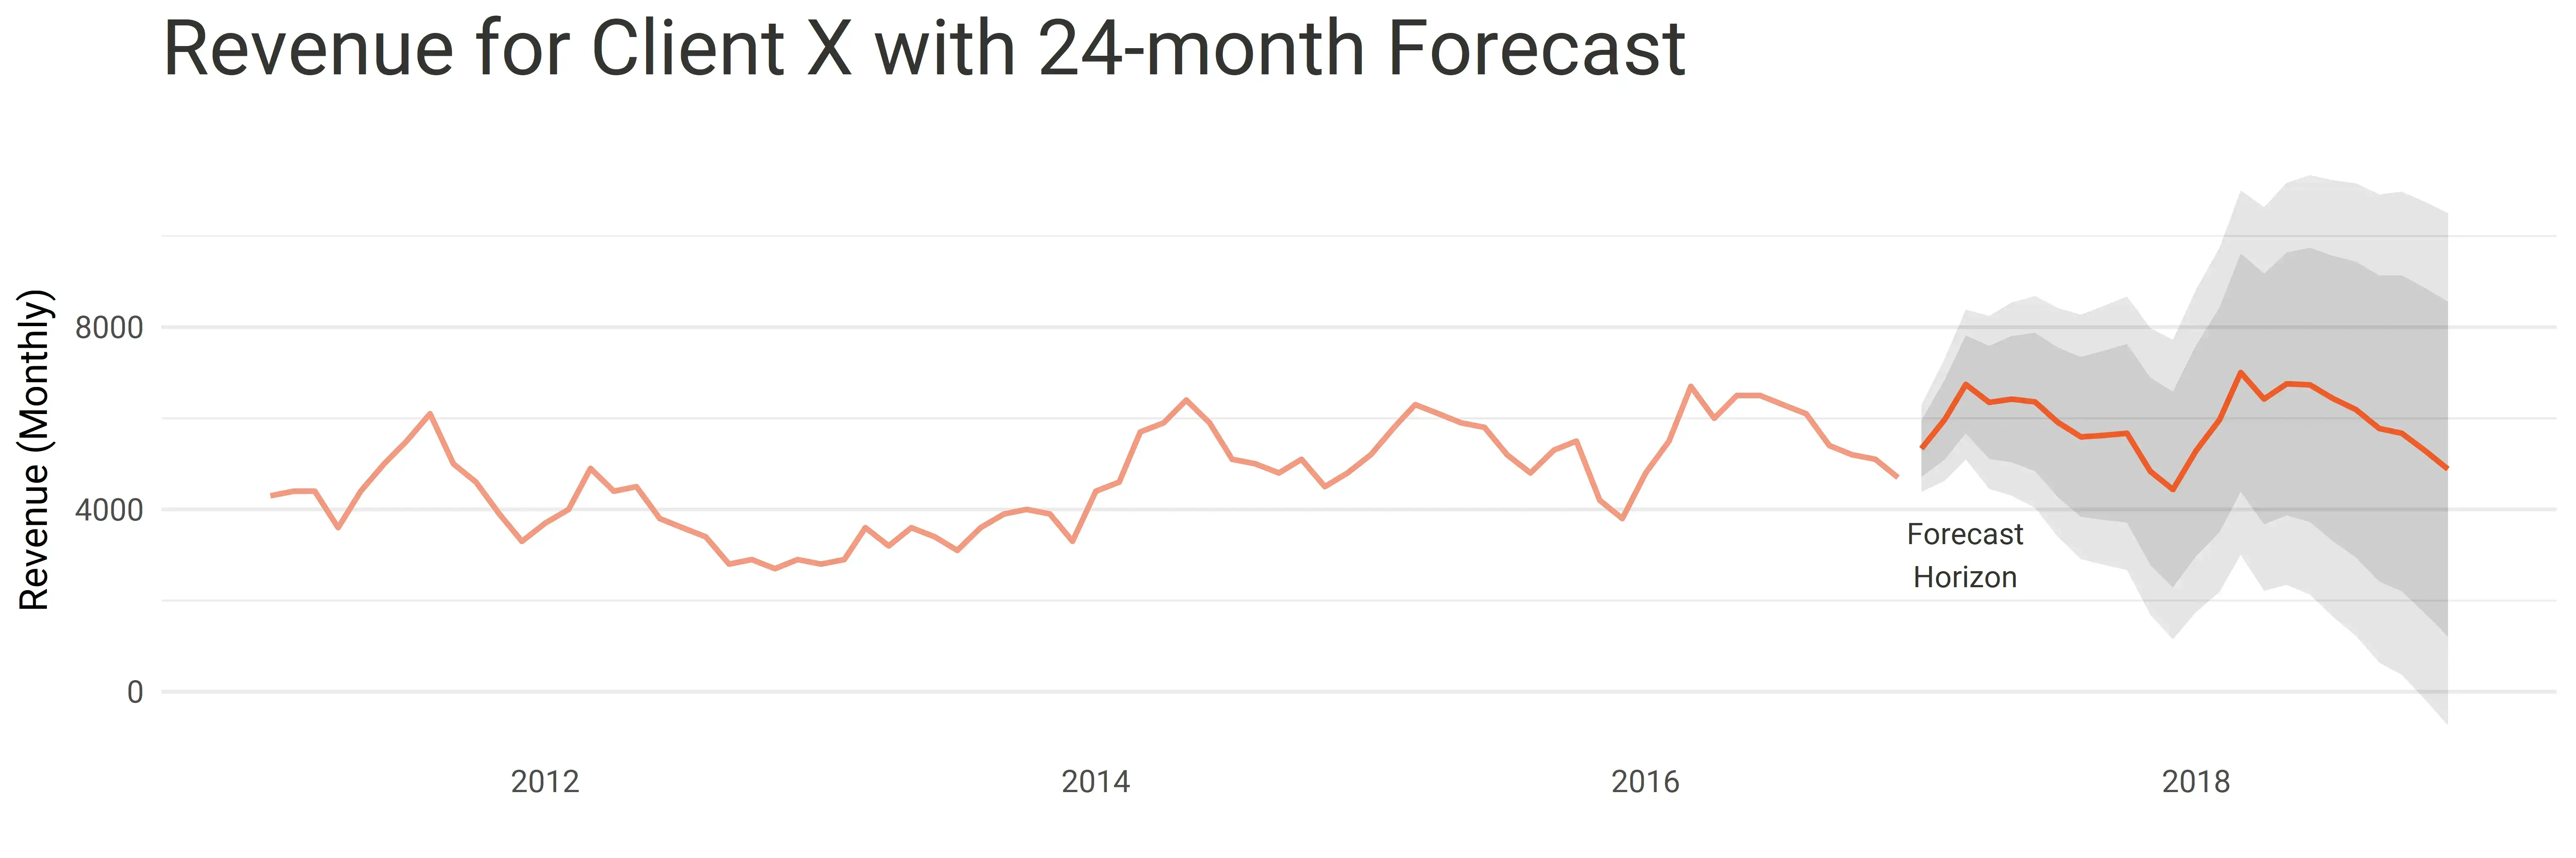
The above forecast shows what Client X now sees to project future revenue - a forecast that captures the trend and the seasonality of the previous revenue records.
With the new forecasting engine integrated into the profitability dashboard, we were able to produce improved forecasts for each department. The effect of moving away from the old forecasting method will be clearer once Client X starts relying on the forecasts produced by the new engine. We have also implemented a way to monitor the accuracy of these forecasting models compared to the resulting real data.
The real benefits of the new engine will become even clearer once the actual budget falls within the error margin of the forecast produced by the engine.
Now Client X has seen what data science can do for their business - this is where it all starts. There have already been requests for additional capabilities.
Data science - giving an edge to forward-thinking businesses
Data science enables an approach backed by the unique hybrid of science and business, giving innovative businesses an edge on competitors still relying on old and stale methods that see them going no further than the status quo.
As you can see from how we worked with Client X, the nature of the CRISP-DM methodology is to respond to unique business needs with a tailored solution, and work with them every step of the way to find the best outcome.
Knowing the foundations of statistical methods and how they have been developed means a data scientist has the unique kind of knowledge enabling them to look at problems and know the means to develop solutions that play to their strengths, ensuring an advantage for those pioneering businesses brave enough to try it.
The last blog in this three-part series will look at the five steps to kicking off data science in your business.
If you have any questions or would like to discuss how data science could solve problems and provide insights for your business, then please get in touch.