Predictive analytics
Predictive analytics is the process of extracting information from existing and potentially external data sets in order to forecast future outcomes and trends. Sandfield employs advanced modelling techniques that assist in understanding complex scenarios such as predicting future customer behaviour, optimal location for a new branch, or delivery times of a consignment based on traffic and weather conditions.
Data insights
The more data you have, the more daunting it becomes to make sense of it. Insights are facts derived from data that lead to better understanding and decision making. Delivering insights requires particular people, technology, and skills - specifically including deep domain knowledge. Here at Sandfield we have a team of specialists with extensive experience in various academic and business fields who are ready to help you to gain actionable insights from your data.
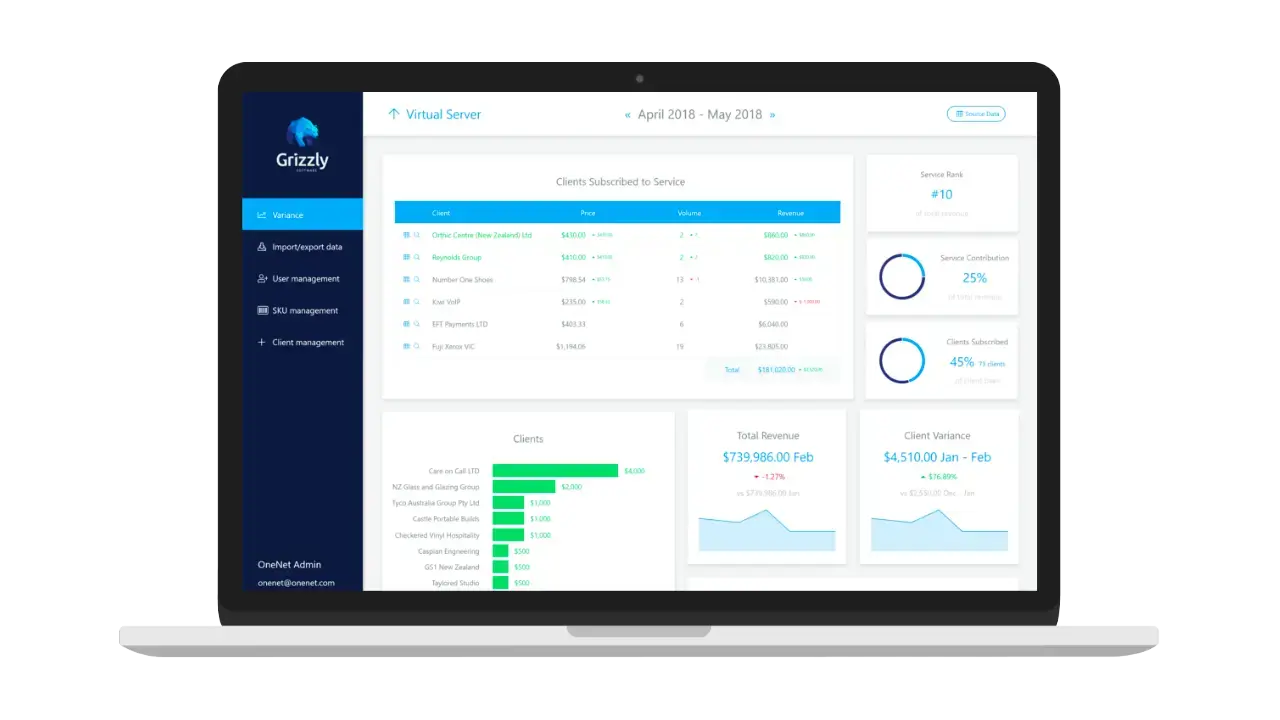
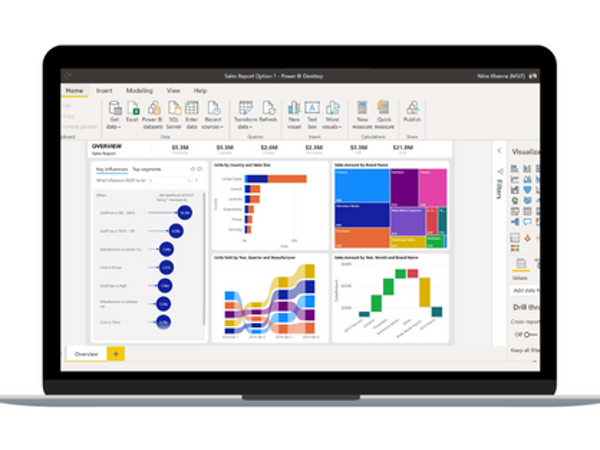
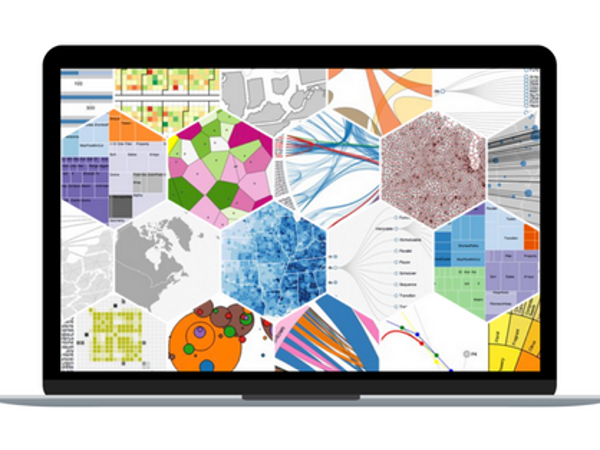
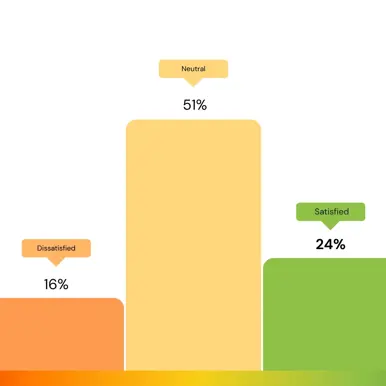
Data visualisation
The vast volumes of data we collect every day can easily overwhelm our capability to distil essential information, drive decisions, and gain insights from this data. Visualisations offer a graphical and pictorial presentation of this data, making it easier to comprehend and identify trends and exceptions. Where previously separate reports would be run to view relationships between data, many different datasets can now be brought together in a single visualisation, allowing relationships to be easily identified.