
A while ago, I attended a business event where the speaker showed off his Excel skills with hundreds of sheets filled with charts and endless tables in one single Excel document. He was an Excel guru you might say as he navigated the whole document with ease. I was very impressed - he knew the precise location of everything he was talking about. However, for anyone else trying to navigate his document, I imagine it wouldn’t take long before the proverbial towel was thrown in. What would be ideal is a self service tool where users can create reports and visualisations themselves without involving IT or a data guru.
According to Gartner, by 2018 most business users and analysts in organisations will have access to self-service tools for data transformation, visualisation and ultimately, insight extraction. As of Feb 2017, the leaders in this category are Tableau, Qlik and Microsoft Power BI.
They all support a large array of visualisation options, but what do you do when the one you need is not there? In this article, we take a look at the extending Power BI’s visualisation library.
Custom Visuals Gallery
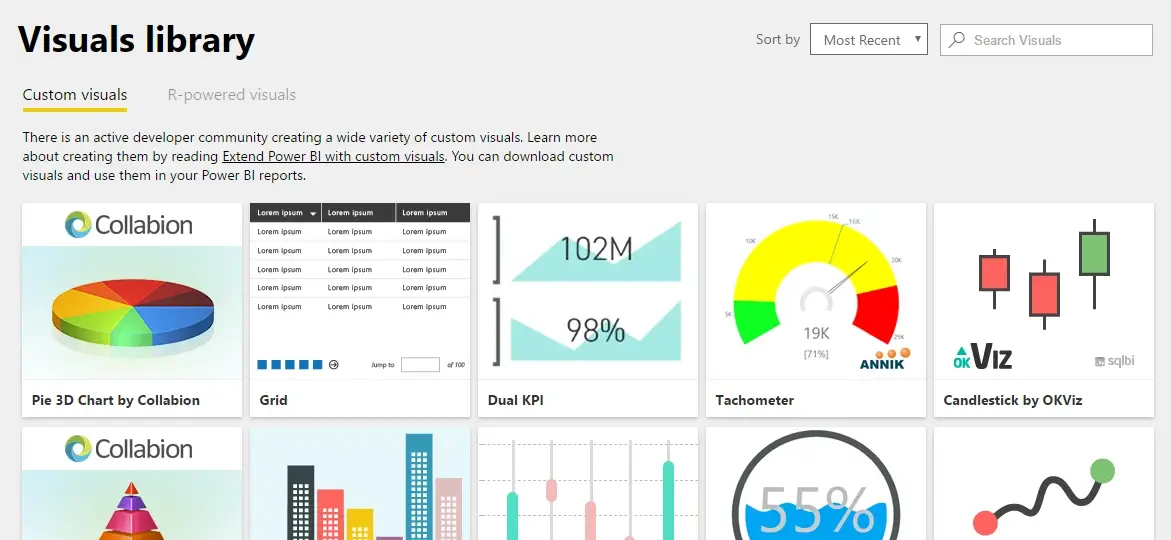
In addition to the built-in visualisations, there is a whole lot more available online in the Custom Visuals Gallery. These are created by the ‘community’, although about one-third are created by Microsoft themselves and the rest are implemented by a mixture of independent individuals and software design companies.
Some of these visualisations are either improved versions of standard visualisations with more functionality, or they are ported from one of the most widely used visualisation frameworks - D3.js.
To use them, download the visualisation you need and import it into your project in Power BI Desktop or Power BI Service. At the time of writing there were 63 custom visualisations available.
Making your own
You've looked at the built-in visualisations, perused the Custom Visuals Gallery but still can’t find that special one. In that case, you will need to develop your own. Fortunately, Power BI natively supports D3.js (Tableau and Qlik don’t), which is one of our favourite data visualisation libraries used in a number of our systems.
For an example of building your Power BI visualisation using D3, read Tsuyoshi Matsuzaki’s MSDN blog.
You also don’t have to use D3 - you can create new visuals using R, or TypeScript and CSS. See the GitHub documentation for examples.
An array of options
Power BI is currently one of the most comprehensive BI tools available. Its out-of-the-box visualisations include all the standard ones and you can easily expand that collection by importing already available custom visualisations, or designing and creating your own. Out of the three leading BI tools today, Power BI is the only one that natively supports D3.js but I’m sure the others won’t be far behind.