The three unspoken rules of a barbeque:
-
Bring a dish to share
-
Provide some beverages
-
Avoid political discussions with Uncle Dave
And while that seems straightforward, in 2023, and in the aftermath of extreme climate events in Aotearoa, I’ve been wondering:
Is carbon off the table too?
It seems to be etching its way onto the list of don’ts for such sacred gatherings, and that’s got me concerned… even rethinking the barbeques I’ve been attending.
At Sandfield, we want to take a different approach and surface the ongoing carbon discussions we’re having. We want to cover some of the encouraging angles we’ve discovered and share our learnings and approaches to the developing role businesses play in their own carbon management. We also want to build upon our previous discourse where we looked at both the challenge and measuring our carbon shadow for the first time in 2021.
As we now embrace post-pandemic processes at Sandfield, it’s worth revisiting how we calculate our carbon footprint, and look deeper again into expanding our scope of emissions measured. Specifically, we’re looking at our ‘carbon shadow’, taking into account what we see as our Scope 3 emissions: employees working from home and the commutes of those who come into the office.
Our context
We are an Auckland-based software provider. Our product is code, built by people. The result is a relatively small carbon footprint: code is written on computers, and, well, people are people. This is an important consideration in reviewing our carbon footprint, as it would be for any business. You must determine scope according to your specific operations.
The following serves as a transparent representation of our model and our approach to carbon, based on developed internal standards.
Carbon’s implications, across workspaces
The influences on our remote work carbon footprint are unique. Expanding the scope to other regions of New Zealand and the world, for example, would result in greater variability. This raises the question: ‘what parameters does one implement when developing an understanding of work-from-home carbon generation?’
In recent years, this question has become increasingly important when capturing carbon data at Sandfield. What we’ve uncovered casts a ‘carbon shadow’ on traditional business practices:
Working from home is more carbon efficient than working from the office.
In actuality, it’s not quite that simple. Just comparing carbon output from employees working in the office versus those at home actually tilts the scales towards working in the office. When we're all together, we put pressure on the same resources, economies of scale kick in, and hey presto, energy consumption per person drops dramatically.

Our total energy consumption split across working from the office compared to at home, both full-time and part-time.
But this isn't the whole picture. Including our Scope 3 emissions means that the often-carbon-generating act of travelling to the office for work is a part of our business’ footprint. And accounting for this costly act quickly tips the scales in favour of working from home.
Commuting at Sandfield
The majority of the Sandfield team are based in Auckland. Our HQ is centrally located in Ponsonby (for those unfamiliar with the Auckland region, as the crow flies it's roughly 2 kms from the CBD). Being central has its benefits - public transport, cycleways, and good coffee - which, for the most part, have positive implications on our carbon footprint.
However, we are an auto-centric nation, with some of the highest car ownership rates in the world. The consequence is a country that builds roads rather than investing in public transport, proliferating ownership rates. Cars are commodious, which comes at a cost: time, congestion and, the more relevant price, carbon.
At Sandfield, the percentage of our team who use public transport or pedestrian resources (i.e., bus, train, walking, and cycling) sits at 28.74%, with private vehicles accounting for 71.26% of our worker’s commutes. Zoom in further and we see 20.19% of these private vehicle trips are made in electric/hybrid cars.
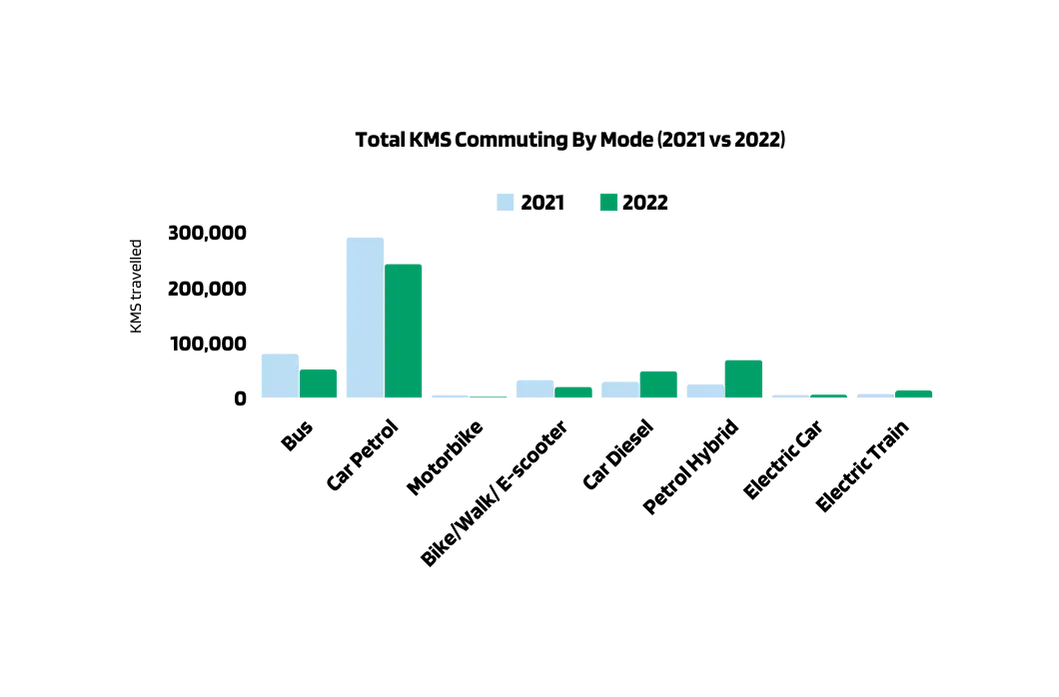 Total kilometers travelled to and from work, across the different modes of transport.
What is there to extrapolate from this? Firstly, while we might perform slightly better than the regional average (79.9% of Aucklanders commute via private vehicle), we still have a ways to go in supporting our employees’ transition to sustainable transport options.
As we take practical steps such as procuring office e-bikes and facilitating the sharing of knowledge, we admit that this is a work in progress. Like many other businesses, our role in fostering change is still being defined and explored.
By far the most significant impact we can have on reducing this part of our carbon footprint has been the move to a hybrid working model. With fewer people travelling to and from our physical office on a regular basis, we have seen significant reductions in overall carbon emissions from commuting, despite increasing the number of employees by 47% in that time.
It’s clear that a full-time WFH arrangement would make sense if carbon reduction was our only objective, but it's not. We must also weigh up other factors such as collaboration, team culture and productivity, as they impact the overall success of the business and our customers.
Plus there’s more to the carbon equation.
Energy at Sandfield
We asked our full-time remote staff what their work-associated electricity costs are, in order to get closer to the answer to our question: ‘what parameters does one implement when developing an understanding of work-from-home carbon generation?’
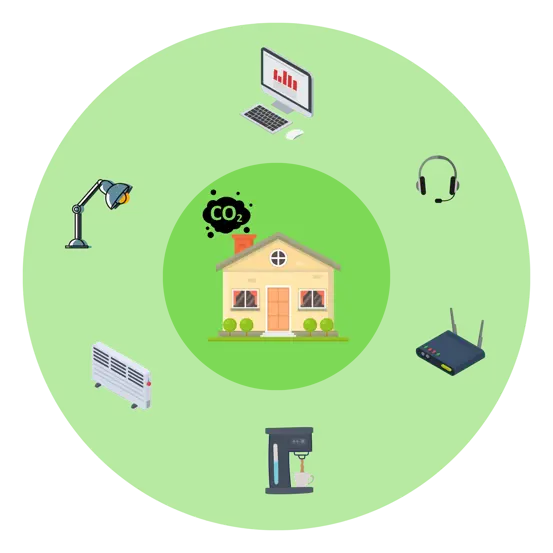
We boiled it down to the following:
-
Computer
-
Displays
-
Router
-
Lights
-
Coffee machine
-
Heating (adjusted for seasonal variability)
-
Accessories including phone, headset, mouse etc.
The result? An average daily kilowatt-hours (kWh) usage.
Taking this one step further, we also captured days working from home versus days in the office for the whole business. Grouping based on days per week at home, multiplied by our average kWh gave us a total annual consumption at home which we then converted to carbon.
Energy usage at the office is mostly linear. You can determine the total energy consumption in kWh by either contacting your energy provider or looking at previous bills, which can then be translated into its carbon equivalent.
It's important to note that New Zealand is ranked among the top five countries for renewable energy globally. When combined with efficient energy usage practices in the office, achieved through the use of automation and high-quality products, the result is low energy costs.
Carbon, compiled
At this point we've ticked the substantial components of our footprint, producing our rendition of a carbon Van Gogh. Energy consumed at home, at the office, and the carbon produced via commutes - the three musketeers of carbon generation for our business.
Here’s how they stack up for Sandfield:
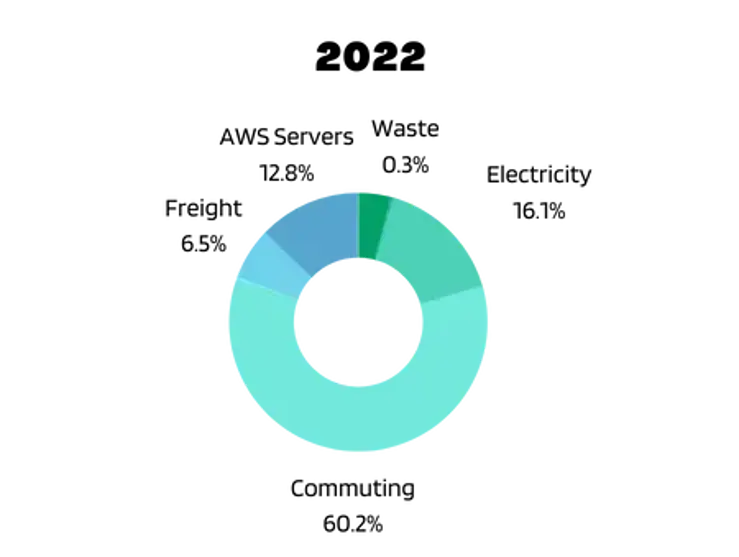
The above graph represents all gathered data for each carbon-generating aspect of our business.
Our learnings, compiled
Lesson #1
Capturing quality carbon data matters.
The Peter Drucker quote ‘You can't improve what you don't measure,’ rings true here.
It’s important that data is specific; know what you want to measure and consider all the factors that contribute. Lean away from averages. Data needs to be quality: comprehensive yet easily collected.
Lesson #2
Our complete carbon scope must impact the way we approach ‘business as usual.’
Measuring carbon emissions is only the first step. It is in the application of this knowledge that we are able to see, and be a part of, real change — whether it be further consideration into how we can best leverage flexible working options, or strengthening our role in creating and encouraging behavioural change internally.
Lesson #3
There’s no shame in talking about it.
The risk of concealing or downplaying conversations about carbon emissions hinder wider progress. This process, akin to ‘greenhushing’, leaves no one better off: transparency begets learning and learning begets change.
The simple truth is that business decisions, and indeed barbeques, are better off for honest conversations about our carbon shadows and efforts to measure, mitigate, and move forward.